Diagnostics Service
The Diagnostics Service allows to remotely monitor the health status of a device. The provided functionalities include:
-
Periodic publishing of diagnostic messages: this service allows to periodically publish messages reporting the usage levels of various device resources, including:
- File system usage
- RAM usage
- CPU usage
- Transmitted/received data amounts per network interface
- MQTT round trip time
- WiFi and cellular signal levels
- Temperature levels
- eMMC 5.0 lifetime
-
Publishing of alerts on event: this services also allows to publish on-event messages if some alert condition occur for some monitored resource, for example:
- Signal level for cellular and wireless interfaces drops below a user-defined threshold
- RAM/CPU/File system usage is above a user-defined threshold
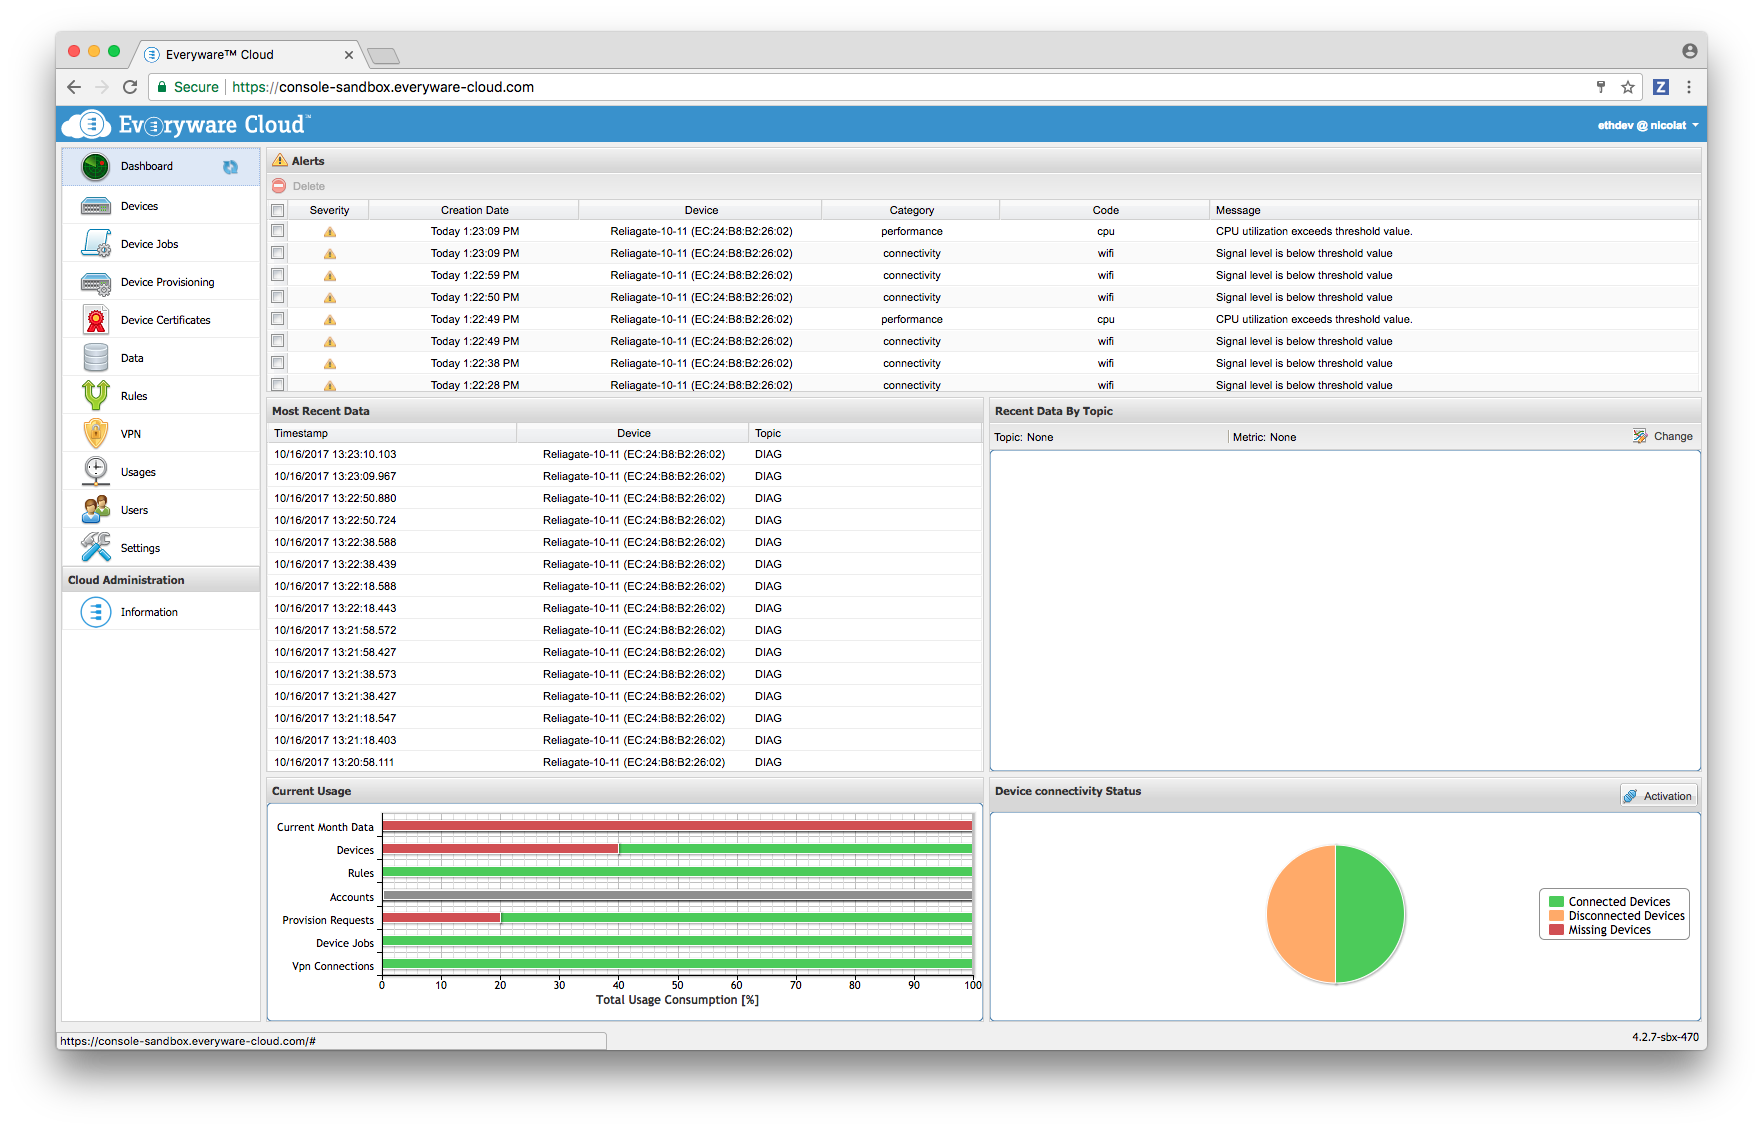
Alert messages are displayed in a dedicated section of the EC Console under Dashboard -> Alerts.

Diagnostics Service Configuration
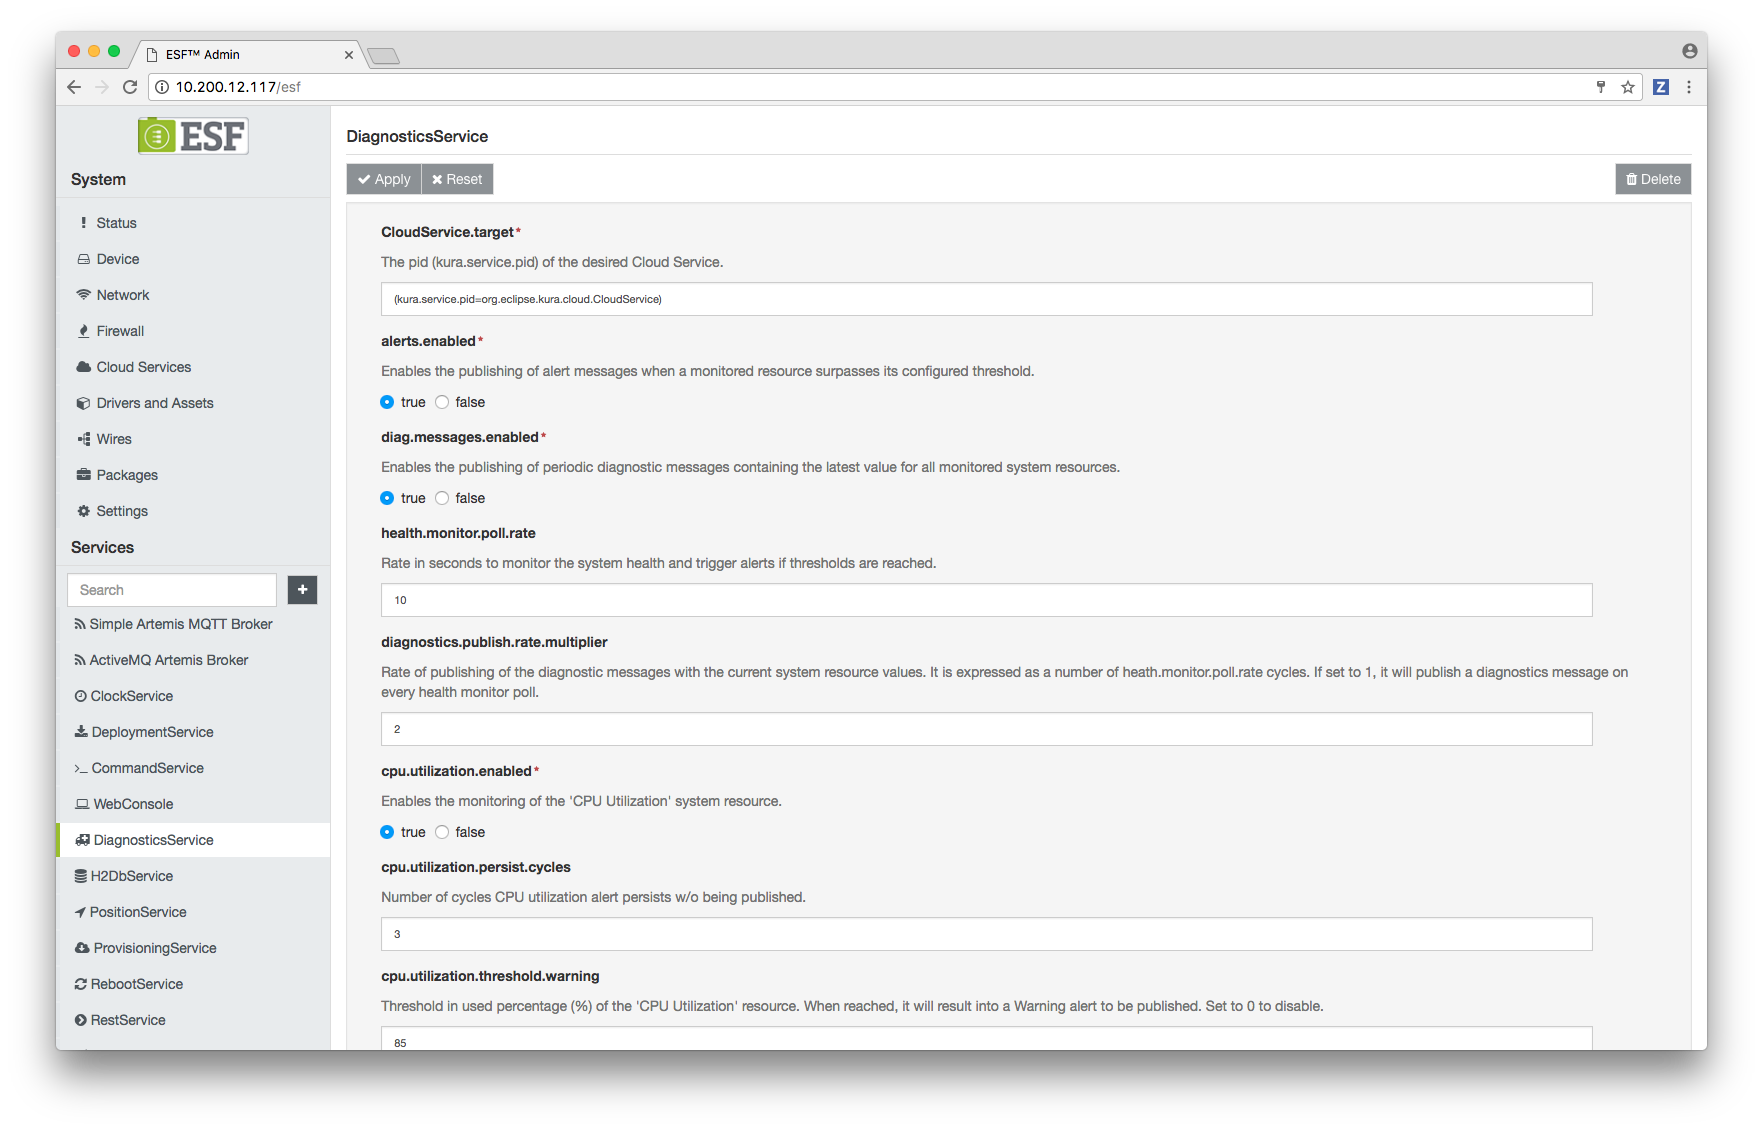
The Diagnostics Service configuration can be accessed through the ESF Web UI by clicking on the corresponding entry under Services.

Diagnostic Messages
The following Diagnostic Service configuration options are relevant for periodic diagnostic message publishing:
-
CloudService.target: this parameter identifies the kura.service.pid of the Cloud Service that will be used to publish the diagnostic messages.
-
alerts.publish.mode: If set to ONCE, a single alert will be published when the monitored resource exceeds the threshold level and one when it returns to normal values. If set to PERIODIC, alerts will be published periodically when the monitored resource is above the thresholds.
-
alerts.enabled: Enables the publishing of alert messages when a monitored resource surpasses its configured threshold.
-
diag.messages.enabled: this parameter globally enables or disables publishing of periodic diagnostic messages.
-
health.monitor.poll.rate: specifies the rate in seconds at which system resources values are sampled by the Diagnostic Service.
-
diagnostics.publish.rate.multiplier: specifies, along with health.monitor.poll.rate, the rate at which periodic diagnostic messages are published. Diagnostic messages will be published every
health.monitor.poll.rate * diagnostics.publish.rate.multiplierseconds. -
Per-resource parameters: Diagnostic message publishing can be selectively enabled/disabled per-resource. For example the cpu.utilization.enabled parameter can be used to enable/disable publishing diagnostic messages for the CPU usage resource only.
If diag.messages.enabled is set to
false, no diagnostic messages will be published, regardless of the value of the per-resource configuration parameters.
Alert Message
Alert messages are published if the value of some resource is above or below a specified threshold. Two severity levels are defined for alerts: Warning and Critical in ascending severity order. Alerts with different severity levels are displayed differently on the EC Console.
The Diagnostics Service configuration contains two parameters for each monitored resource that allow to specify the thresholds that, if exceeded by the resource value, will trigger the publishing of a warning or critical level alert.
The following Diagnostic Service configuration options are relevant for alert message publishing:
-
alerts.enabled: this parameter globally enables or disables publishing of alert messages.
-
health.monitor.poll.rate: specifies the rate in seconds at which system resources values are sampled by the Diagnostic Service, when this happens the DiagnosticService may publish alerts if specific conditions are verified by the sampled values. This parameter therefore specifies the maximum publish rate for the alert messages.
-
Warning threshold parameters: The configuration parameters whose name contains threshold.warning specify the resource-dependent value threshold that, if exceeded, triggers the publishing of a warning level alert message.
-
Critical threshold parameters: The configuration parameters whose name contains threshold.critical specify the resource-dependent value threshold that, if exceeded, triggers the publishing of a critical level alert message.
-
Persist cycles parameters: If the value of a parameter whose contains persist.cycles is set to a value greater that 1, then an alert for the corresponding resource will be published only if its trigger condition is verified during the last n consecutive health monitor cycles. The duration of an health monitor cycle is specified by the health.monitor.poll.rate parameter.
Logging
Starting from ESF 7.0, the DiagnosticsService is able to log diagnostic metrics and alerts, this can be used to collect that information using the Log Analytics feature. This functionality is disabled by default.
The following parameters are related to logging:
-
alerts.log.enabled: Defines whether alerts should be reported on device logs.
-
diag.log.level: The log level to be used when logging diagnostic metrics. Set to DISABLED to disable diagnostic metric logging.
-
diag.log.mode: Defines whether diagnostic metrics should be logged grouped as a single log entry or in different log entries.
Diagnostic Service features
This section provides more details about some specific Diagnostic Service features.
API
Java APIs
The Diagnostics Service provides public Java APIs that allow to:
- Retrieve the current state of diagnostics metrics and alerts
- Publish alerts
- Add extension components that can be used to generate additional metrics and alerts. These components can also add parameters to Diagnostics Service configuration.
A Diagnostics Service example component is available as part of ESF development envirnoment.
The API documentation is provided in form of Javadoc. The Javadoc HTML files are contained in the jar file, that can be decompressed as a regular zip archive.
Watchdog reboot monitoring
Starting from ESF version 5.1.0, the Diagnostics Service also publishes the cause of the last reboot triggered by the Watchdog Service as an alert message. This functionality is enabled by default and there are no configuration parameters related to it.
Temperature sensor monitoring
Starting from ESF 5.2.0, the Diagnostics Service manages and publishes the temperature values of the enabled temperature sensors available in the Gateway.
eMMC 5.0 lifetime monitoring
Starting from ESF 7.0.0, the Diagnostics Service is capable of sending diagnostic messages related to the following parameters specified by the JEDEC Embedded Multi-Media Card (eMMC) Electrical Standard (5.0) JESD84-B50:
- DEVICE_LIFE_TIME_EST_TYP_A: Reports the lifetime status of "Type A" memory.
- DEVICE_LIFE_TIME_EST_TYP_B: Reports the lifetime status of "Type B" memory.
- PRE_EOL_INFO: Reports device lifetime derived from the usage of reserved blocks.
The reported parameters values are in the following ranges:
- DEVICE_LIFE_TIME_EST_TYP_A, DEVICE_LIFE_TIME_EST_TYP_B: The allowed values are in the [1, 11] range. Values from 1 to 10 indicate that the device used between
(n-1)*10andn*10percent of the estimated lifetime for the corresponding type of memory, wherenis the parameter value. A value of 11 indicates that the device exceeded the estimated lifetime. - PRE_EOL_INFO: The allowed values are 1, 2 and 3.
- 1 Normal: reports normal usage of reserved blocks
- 2 Warning: reports that the device used 80% or reserved blocks.
- 3 Urgent
eMMC 5.0 lifetime monitoring will be enabled only if the /usr/bin/mmc binary provided by the mmc-utils package is available on the system.
The Diagnostic Service will monitor the eMMC 5.0 capable devices represented by a /dev/mmcblkN device, where N is an integer.
For each mmcblkN device, the following diagnostic metrics will be published:
device_life_time_est_typ_a_mmcblkNdevice_life_time_est_typ_b_mmcblkNpre_eol_info_mmcblkN
The Diagnostic Service will also publish alerts related to the monitored devices, the parameter and device name is reported in the alert message. Alerts and diagnostic messages can be configured using the dedicated configuration parameters.
Tamper detection monitoring
The ReliaGATE 10-14 hardware tamper detection service and AIDE Intrusion Detection support publishing alerts on tamper event. These services only support the Publishing of alerts on event mode, and will publish the alerts on event even if the DiagnosticsService is configured to publish alerts periodically.
These services add configuration parameters to DiagnosticsService configuration to allow enabling/disabling Alert reporting and setting a custom alert code.
The generated alerts will also be logged to Systemd journal if the diagnostics service if this feature is enabled using the alerts.log.enabled parameter.
Filesystem monitoring
The diagnostics service supports monitoring the filesystems mounted on the device and reporting diagnostic information and alerts about them.
Diagnostic metrics
A metric with the following name is published for each monitored filesystem:
diag_fs_usg_<fstype>_<mountpoint>
reporting the amount of used space in percentage. <fstype> is the filesystem type as listed in /proc/filesystems(e.g. ext4, btrfs, tmpfs) and _<mountpoint>is the path of the filesystem mount point with the / character replaced by _. For example the name of the metric related to a tmpfs filesystem mounted over /var/volatile would be diag_fs_usg_tmpfs_var_volatile.
The metric name for the root filesystem is in the diag_fs_usg_<fstype> form (the mountpoint suffix is not present).
In addition to the metric reporting filesystem usage, the following metrics will be published for the rootfs only:
diag_disk_rd_cnt: Disk read byte count for the root filesystem.diag_disk_rd_ops: Disk read operation count for the root filesystem.diag_disk_wt_cnt: Disk write byte count for the root filesystem.diag_disk_wt_ops: Disk write operation count for the root filesystem.
Alerts
The diagnostics service support sending an alert if usage ratio for a given filesystem exceeds configurable warning and critical thresholds.
Alert and diagnostics message publishing can be configured individually for each filesystem.
Note about specific filesystem types
- Starting from ESF 7.6.0, monitoring of
squashfsfilesystems has been disabled, sincesquashfsfiles are readonly archives that have no free space. Diagnostic messages and alerts forsquashfsfilesystems will no longer be published and the related configuration options have been removed.- Starting from ESF 7.6.0, a new
fs.monitoring.overlayfs.enabledboolean configuration parameter has been added, which defines whetheroverlayfsfilesystems should be monitored or not. Default is true. If set to false, no alerts and diagnostic messages related tooverlayfsfilesystems will be sent, and the related configuration options will not be shown.
Updated 6 months ago
