Diagnostics Service
The Diagnostics Service allows to remotely monitor the health status of a device. The provided functionalities include:
-
Periodic publishing of diagnostic messages: this service allows to periodically publish messages reporting the usage levels of various device resources, including:
- File system usage
- RAM usage
- CPU usage
- Transmitted/received data amounts per network interface
- MQTT round trip time
- WiFi and cellular signal levels
- Temperature levels
-
Publishing of alerts on event: this services also allows to publish on-event messages if some alert condition occur for some monitored resource, for example:
- Signal level for cellular and wireless interfaces drops below a user-defined threshold
- RAM/CPU/File system usage is above a user-defined threshold
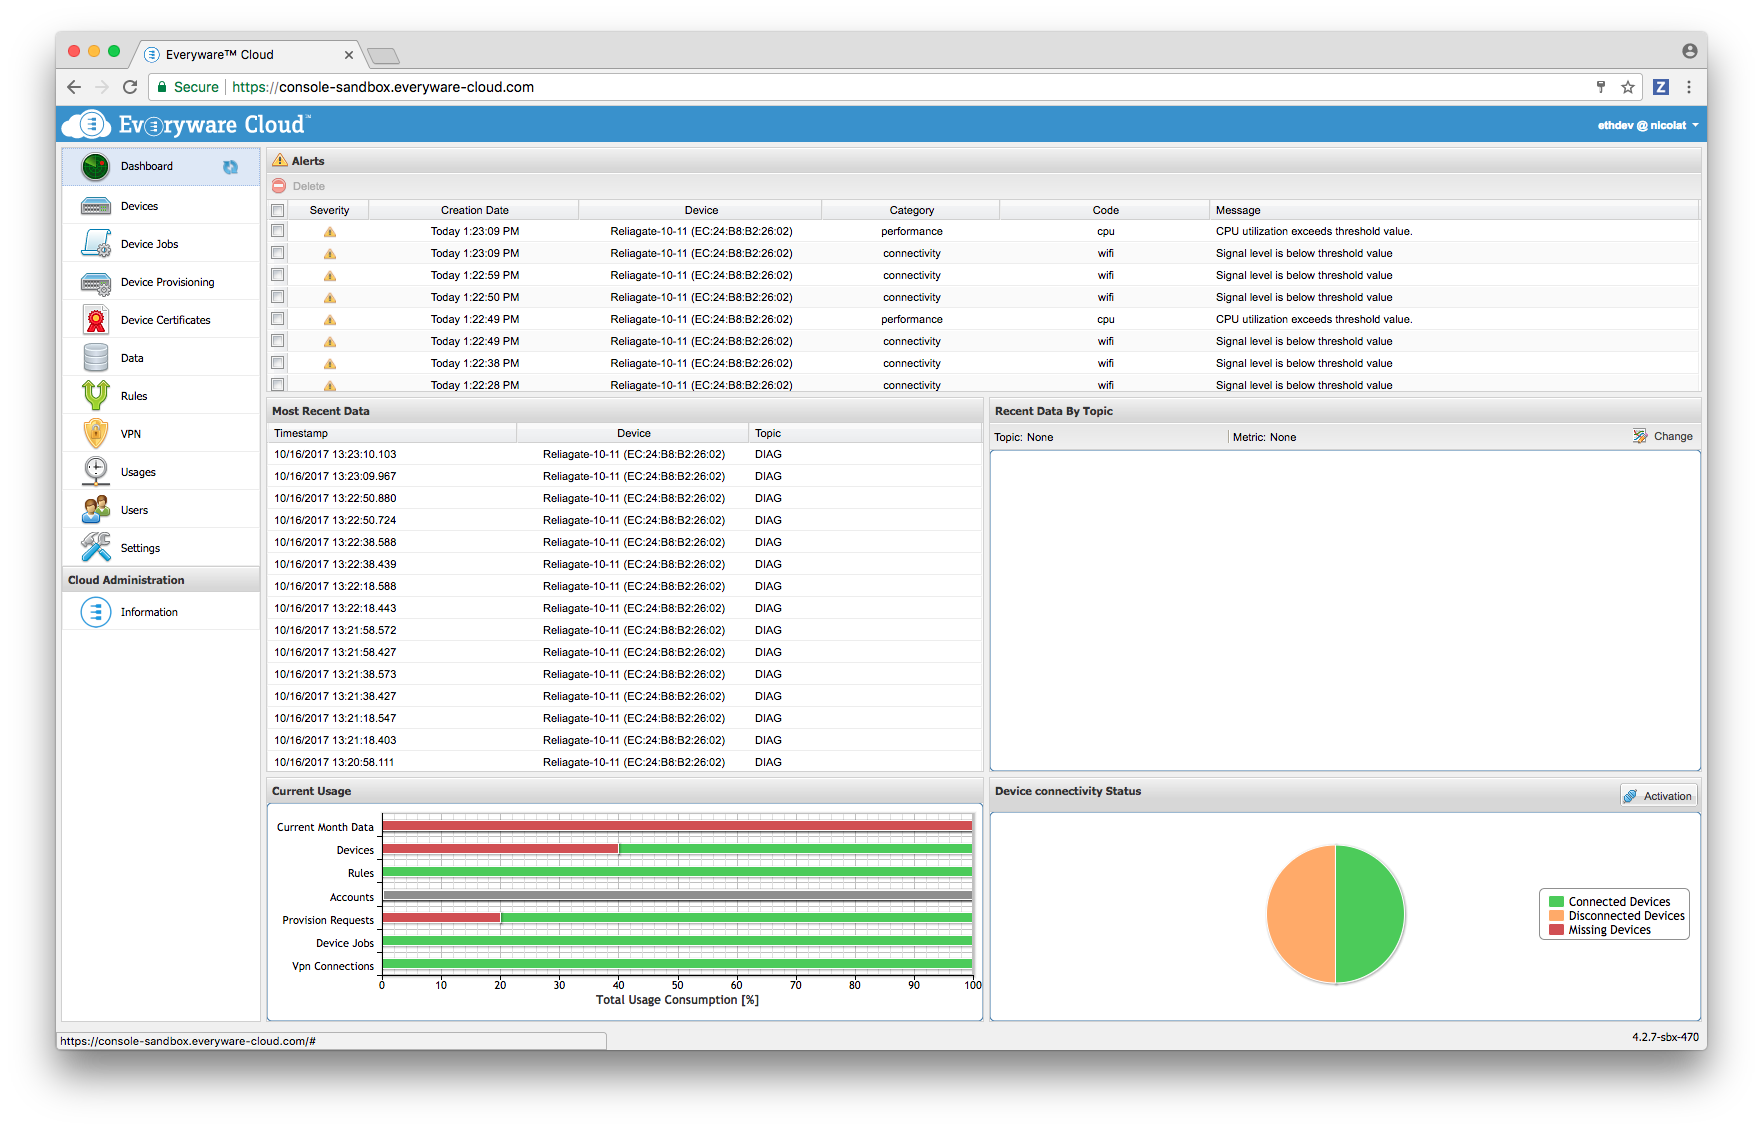
Alert messages are displayed in a dedicated section of the EC Console under Dashboard -> Alerts.

Diagnostics Service Configuration
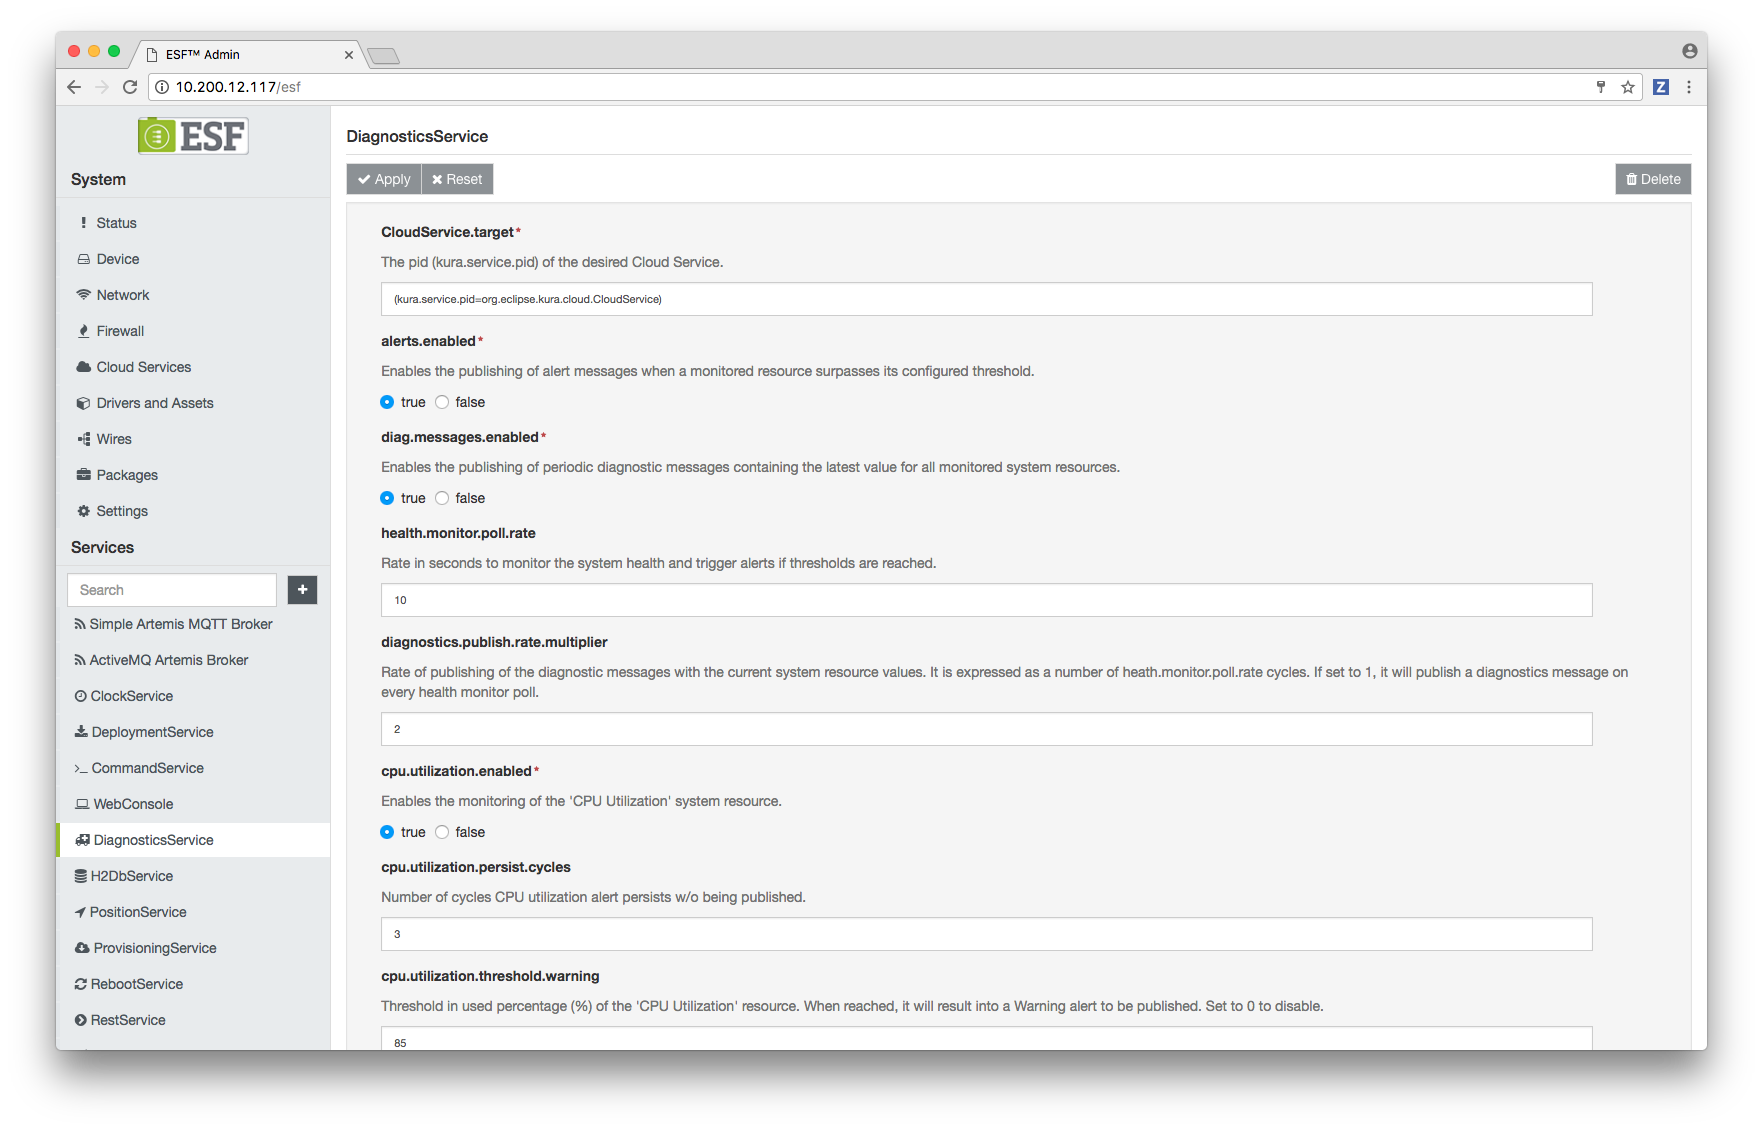
The Diagnostics Service configuration can be accessed through the ESF Web UI by clicking on the corresponding entry under Services.

### Diagnostic Messages
The following Diagnostic Service configuration options are relevant for periodic diagnostic message publishing:
-
CloudService.target: this parameter identifies the kura.service.pid of the Cloud Service that will be used to publish the diagnostic messages.
-
alerts.publish.mode: If set to ONCE, a single alert will be published when the monitored resource exceeds the threshold level and one when it returns to normal values. If set to PERIODIC, alerts will be published periodically when the monitored resource is above the thresholds.
-
alerts.enabled: Enables the publishing of alert messages when a monitored resource surpasses its configured threshold.
-
diag.messages.enabled: this parameter globally enables or disables publishing of periodic diagnostic messages.
-
health.monitor.poll.rate: specifies the rate in seconds at which system resources values are sampled by the Diagnostic Service.
-
diagnostics.publish.rate.multiplier: specifies, along with health.monitor.poll.rate, the rate at which periodic diagnostic messages are published. Diagnostic messages will be published every
health.monitor.poll.rate * diagnostics.publish.rate.multiplierseconds. -
Per-resource parameters: Diagnostic message publishing can be selectively enabled/disabled per-resource. For example the cpu.utilization.enabled parameter can be used to enable/disable publishing diagnostic messages for the CPU usage resource only.
If diag.messages.enabled is set tofalse, no diagnostic messages will be published, regardless of the value of the per-resource configuration parameters.
Alert Message
Alert messages are published if the value of some resource is above or below a specified threshold. Two severity levels are defined for alerts: Warning and Critical in ascending severity order. Alerts with different severity levels are displayed differently on the EC Console.
The Diagnostics Service configuration contains two parameters for each monitored resource that allow to specify the thresholds that, if exceeded by the resource value, will trigger the publishing of a warning or critical level alert.
The following Diagnostic Service configuration options are relevant for alert message publishing:
-
alerts.enabled: this parameter globally enables or disables publishing of alert messages.
-
health.monitor.poll.rate: specifies the rate in seconds at which system resources values are sampled by the Diagnostic Service, when this happens the DiagnosticService may publish alerts if specific conditions are verified by the sampled values. This parameter therefore specifies the maximum publish rate for the alert messages.
-
Warning threshold parameters: The configuration parameters whose name contains threshold.warning specify the resource-dependent value threshold that, if exceeded, triggers the publishing of a warning level alert message.
-
Critical threshold parameters: The configuration parameters whose name contains threshold.critical specify the resource-dependent value threshold that, if exceeded, triggers the publishing of a critical level alert message.
-
Persist cycles parameters: If the value of a parameter whose contains persist.cycles is set to a value greater that 1, then an alert for the corresponding resource will be published only if its trigger condition is verified during the last n consecutive health monitor cycles. The duration of an health monitor cycle is specified by the health.monitor.poll.rate parameter.
Starting from ESF version 5.1.0, the Diagnostics Service also publishes the cause of the last reboot triggered by the Watchdog Service as an alert message. This functionality is enabled by default and there are no configuration parameters related to it.
Starting from ESF 5.2.0, the Diagnostics Service manages and publishes the temperature values of the enabled temperature sensors available in the Gateway.
Updated 6 months ago
