TI SensorTag Driver
ESF provides a specific driver that can be used to interact with Texas Instruments SensorTag devices. The driver is available only for gateways that support the new Bluetooth LE APIs.
This tutorial will explain how to configure a Wire graph that connects with a SensorTag, reads sensor values and publishes data to a cloud platform.
The SensorTag driver can be used only with TI SensorTags with firmware version >1.20. If your device has an older firmware, please update it.
Configure the TI SensorTag Application
- Install the TI SensorTag driver from the Eclipse Kura Marketplace
- On the ESF Administrative Web Interface, instantiate a SensorTag Driver:
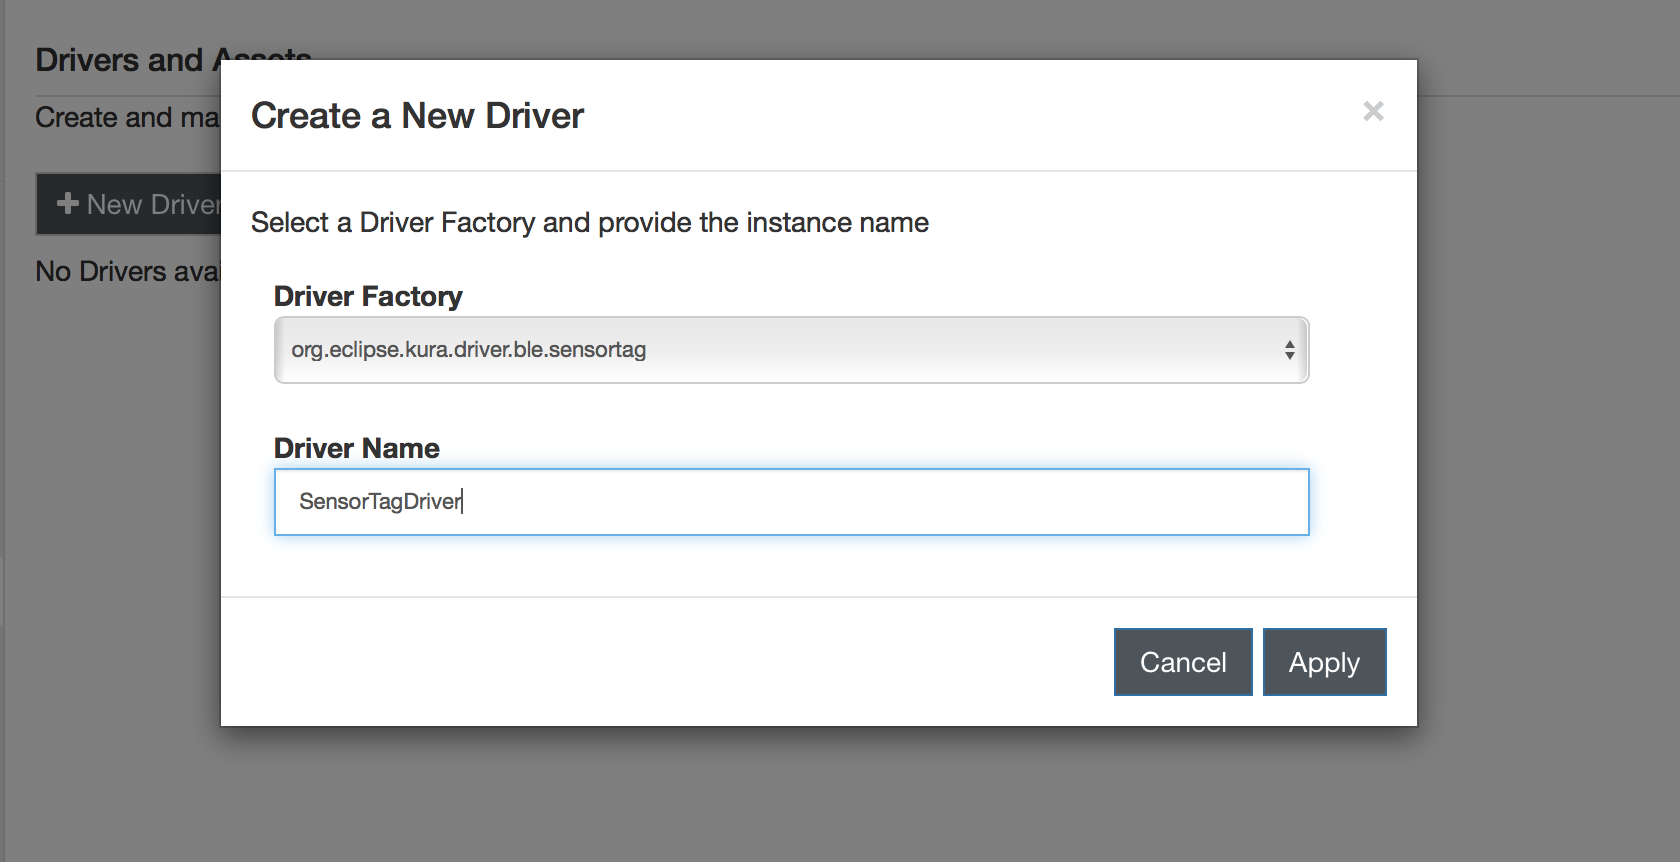
- Under System, select Drivers and Assets and click on the New Driver button.
- Select
org.eclipse.kura.driver.ble.sensortagas Driver Factory, type a name in Driver Name and click the Apply button: a new driver will be instantiated and listed in the page. - Select the newly created Driver instance and configure the Bluetooth interface name (i.e. hci0).

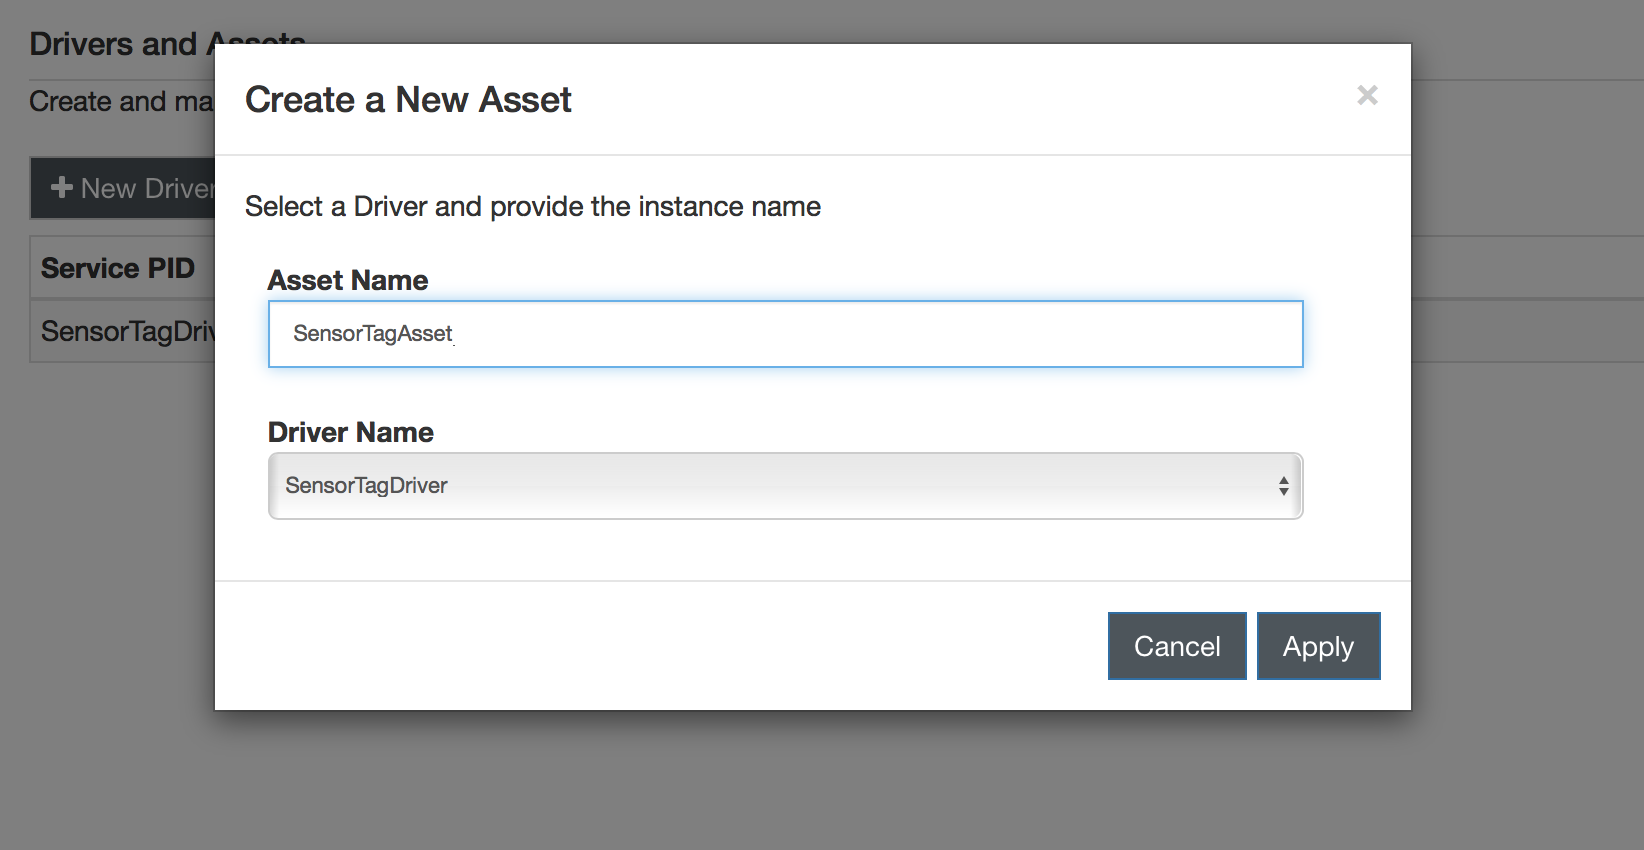
- In the Drivers and Assets tab add a new asset and associate it to the SensorTag driver:
- Click on the New Asset button and fill the form with the Asset Name, selecting the driver created at point 2. Click Apply and a new asset will be listed.
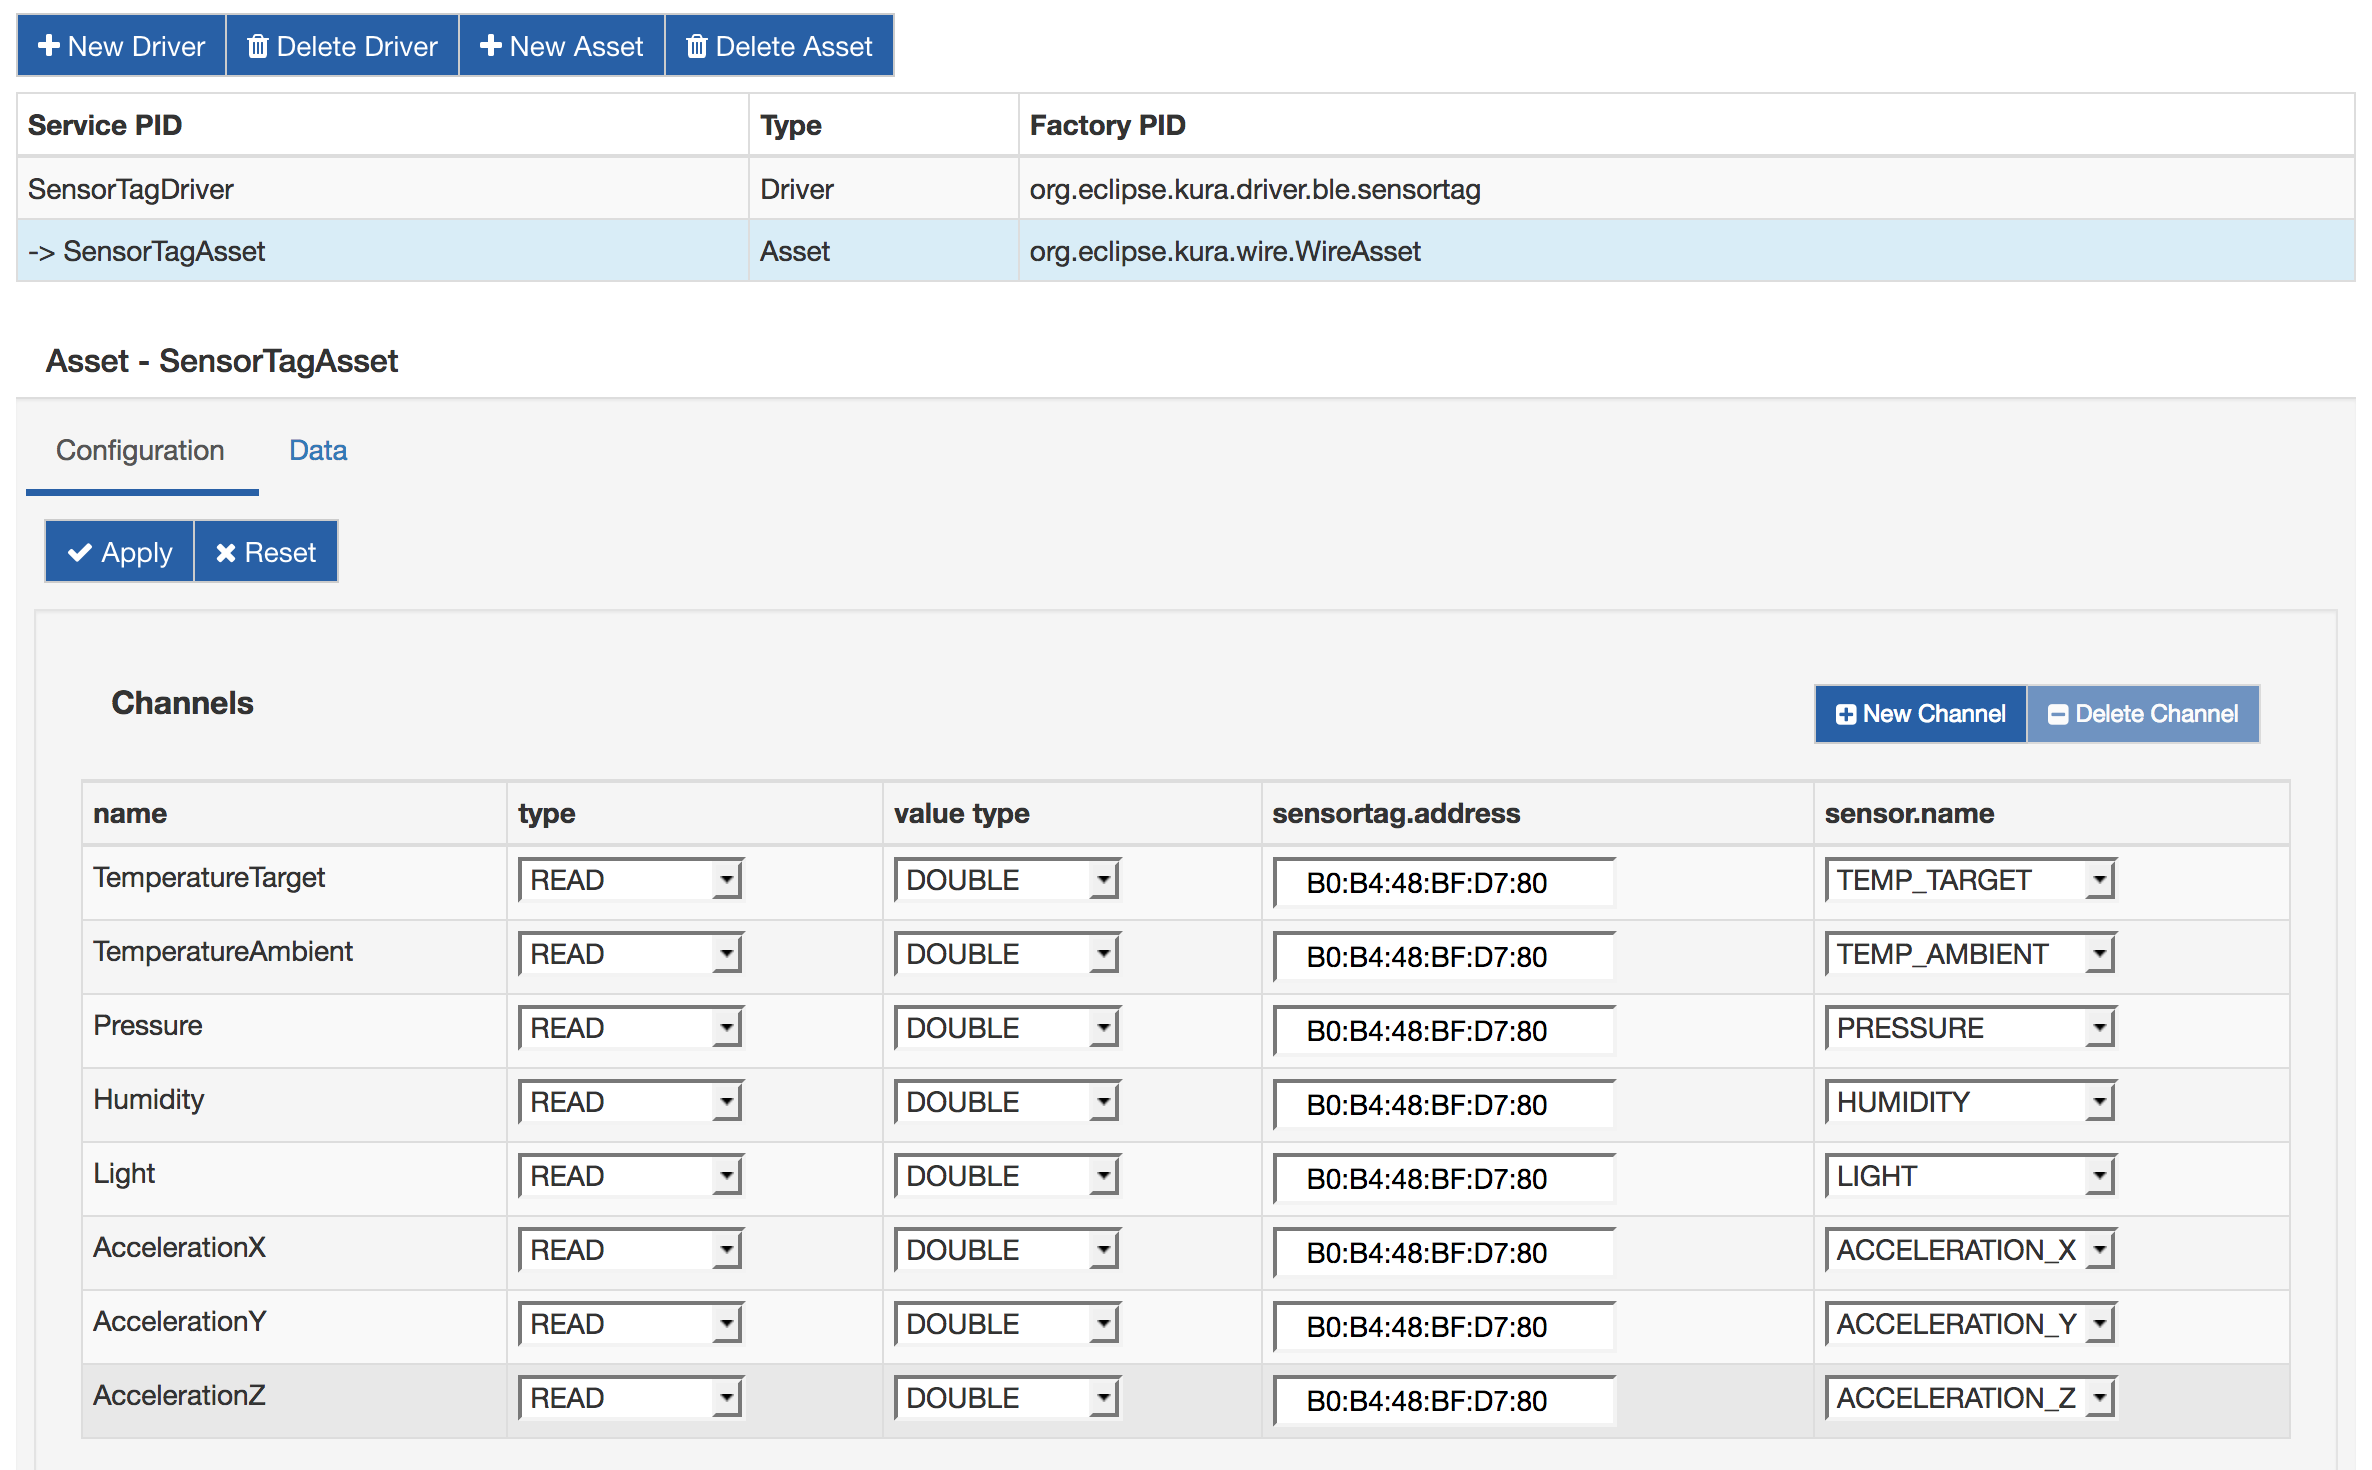
- Click on the new asset and configure it, adding the channels. Each channel represents a single sensor on the SensorTag and it can be chosen from the sensor.name menu. Fill the sensortag.address with the DB address of the SensorTag you want to connect to. The value.type should be set to double, but also the other choices are possible.
- Click Apply.

The resulting configuration for the Asset instance:

- Click on Wires under System.
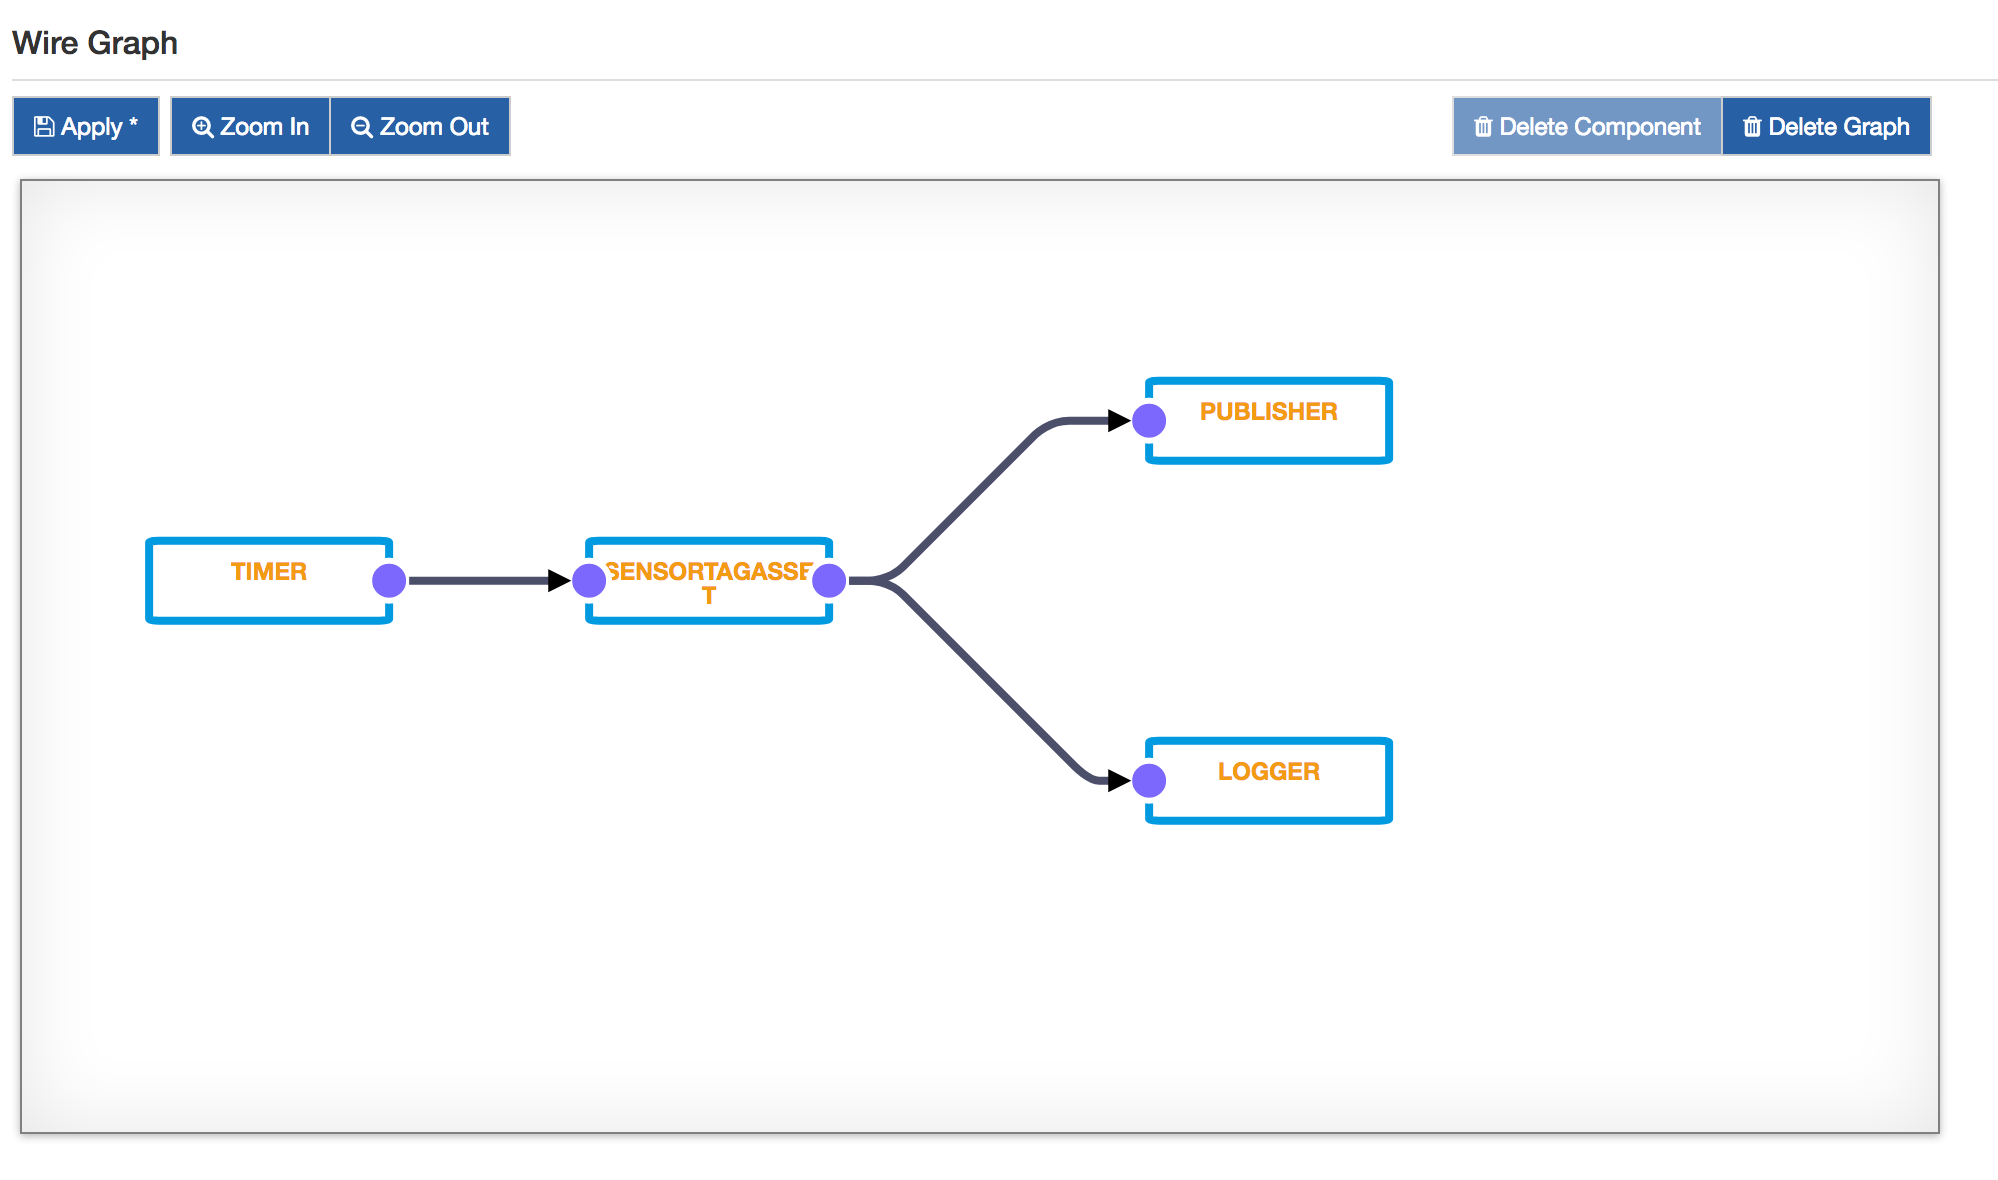
- Add a new Timer component and configure the interval at which the sensors will be sampled.
- Add a new Asset selecting the previously added SensorTag asset.
- Add a new Publisher component and configure the chosen cloud platform stack in the cloud.service.pid option.
- Add a Logger component
- Connect all the created components together as depicted in the image below.
- Click on Apply and check the logs and the cloud platform verifying that the data is correctly published.

Updated 5 months ago
