How to add an AWS CloudWatch Dashboard
AWS IoT provides a service, named CloudWatch, that can collect and show in the form of logs, graphs, and events the MQTT traffic generated by the devices connected to the IoT service. It provides to the user the full picture of all the events sent to and from AWS IoT Core service. More information on CloudWatch can be found here.
In order to view logs in AWS CloudWatch, you must first enable logs for AWS IoT Core, as they are disabled by default. To enable AWS IoT Core logging, you must create an IAM role to enable logging in AWS IoT Core to monitor in AWS CloudWatch.
- Sign in to the Amazon AWS Console here, if not already logged in.
- Navigate to the AWS IAM console.
- Click on Roles.
- Under AWS service, choose IoT -> Next: Permissions.
- Choose at least the AWSIoTLogging policy to attach. Use default if already shown.
- Select Next: Tags <leave blank> -> Next: Review -> provide meaningful name to your Role name, e.g.
aws-iot-access-role-> Create role. - Navigate to AWS IoT console.
- Get started (if no resources are provisioned yet).
- Select Settings and Logs -> Edit to enable logging.
- Change "Level of verbosity" to "Debug (most verbose)" and "Set role" to your created IAM role
aws-iot-access-role. - Click Update and now logging is enabled.
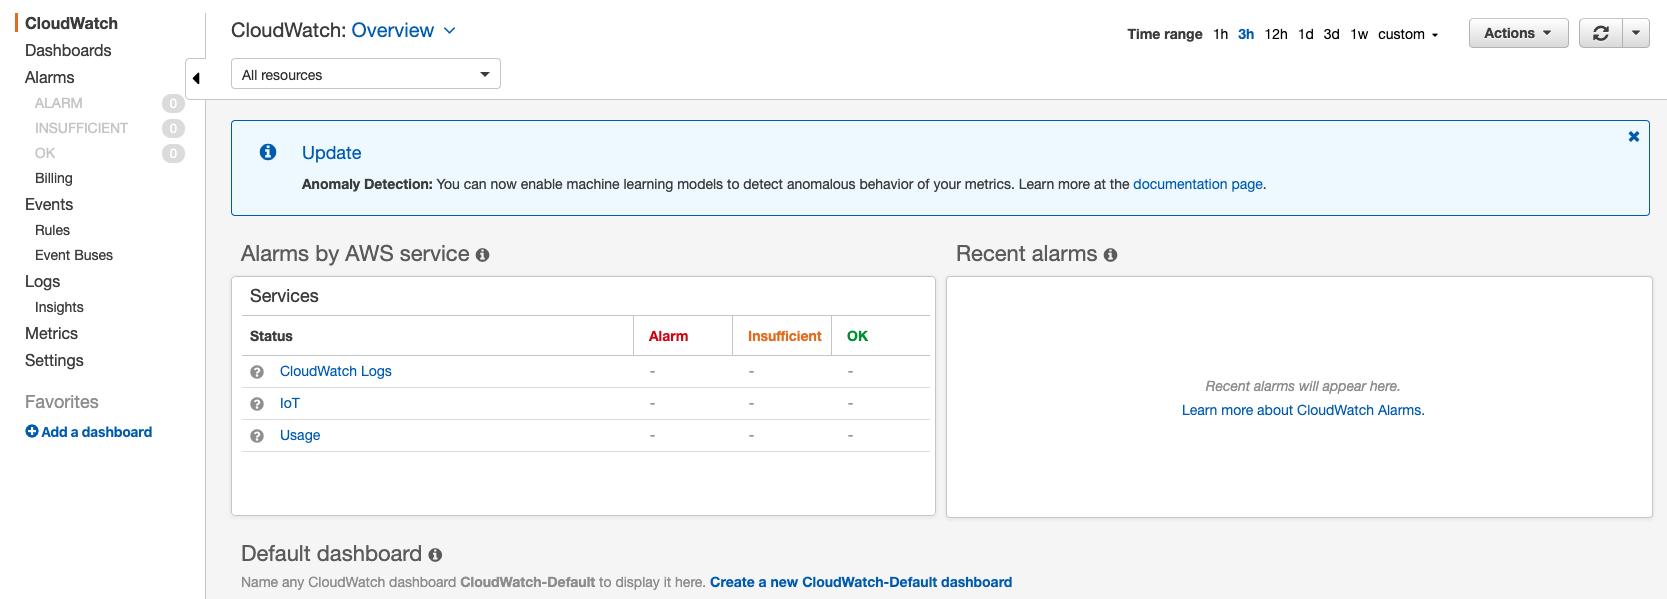
- Select CloudWatch from the Services tab under the main toolbar. You should see this window:

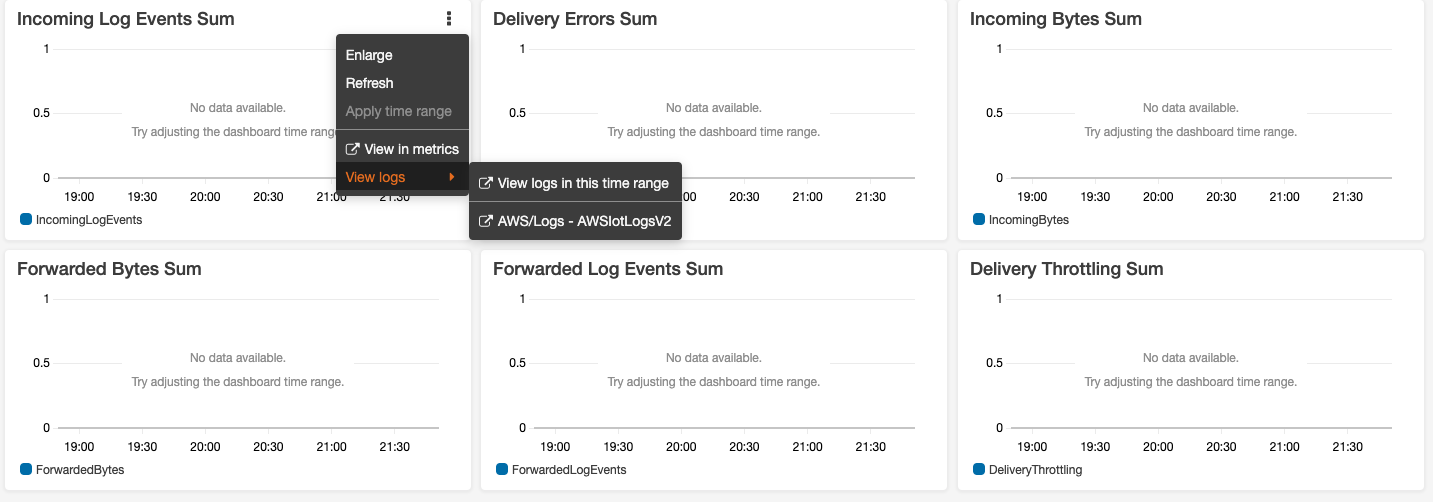
You can view all data sent and received by AWS IoT Core in the form of logs by selecting CloudWatch Logs under Services on the main page. From that page, you can choose to monitor all incoming and outgoing logs seen by AWS IoT Core. Next to Incoming Log Events Sum, click on the ... icon then select View logs -> AWS/Logs - AWSIotLogsV2, as shown below:

You may also create a dashboard on the CloudWatch console to view MQTT traffic in multiple ways.
Dashboard Creation
- Click Add a dashboard from the CloudWatch left panel. Provide a name for your dashboard, e.g.
MyAwsIotLogging. - You can now add multiple widgets to your dashboard in the form of line metrics, bar graphs, free text, or chart insight.
For demonstration purposes, we will create a "Line" widget, a "Stacked area" widget, and a "Query results" widget for our dashboard.
- Start by adding a Line widget to show metrics over a timeline. Select Line and Configure.
- Choose the "IoT" metrics -> "Protocol Metrics" and filter on all MQTT events.
- Create widget.
- Add a "Stacked area" widget by clicking Add widget from your dashboard. Then select Stacked area -> Configure. Follow the same procedure to filter on all MQTT traffic.
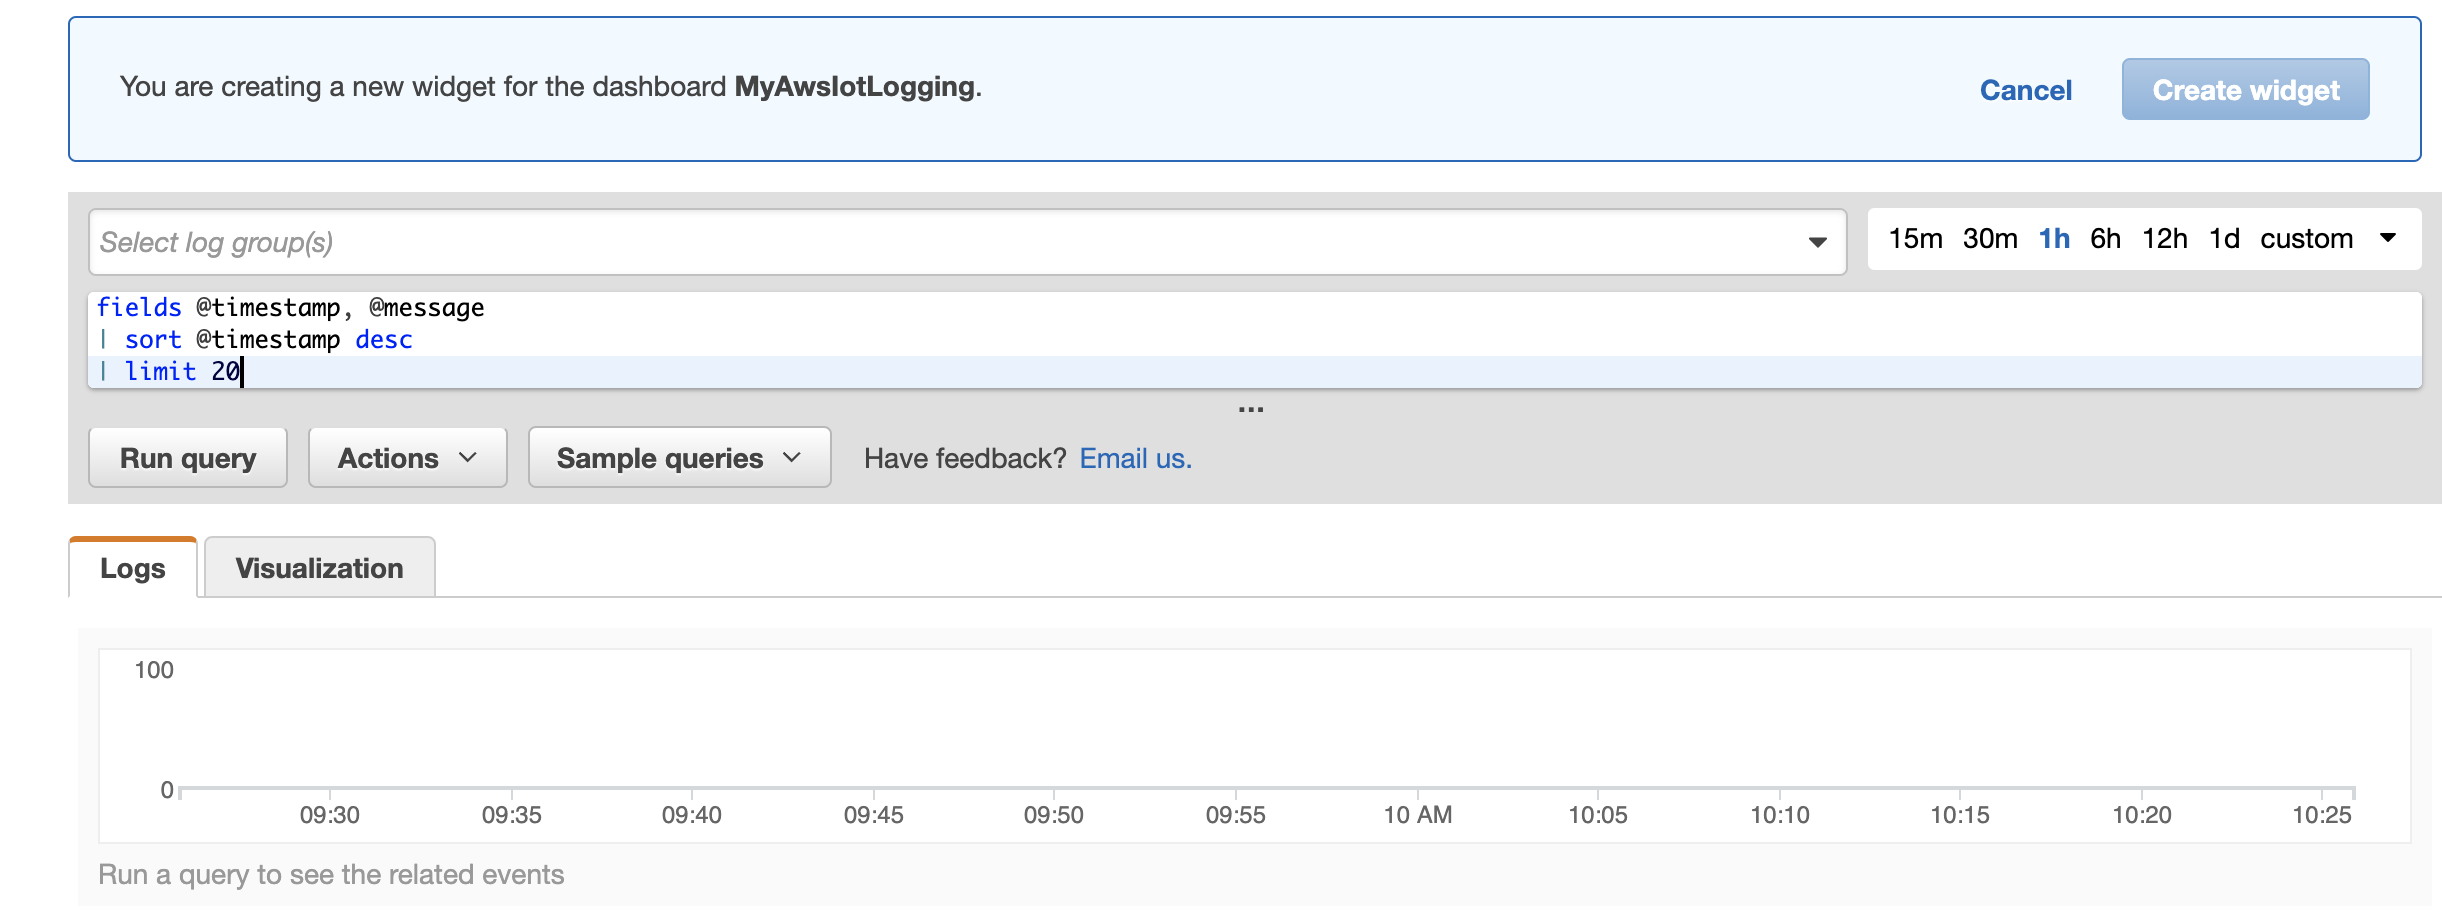
- Add a chart visualization by adding a "Query results" widget to your dashboard. Configure the "Query results" chart by selecting AWSIotLogsV2 from the "Select log group(s)" drop-down. Create widget.
You can also edit the time range and filter on specific logs shown, calculate stats, or sort the logs in ascending or descending order. Refresh your dashboard to see all current events.

Updated 3 months ago
