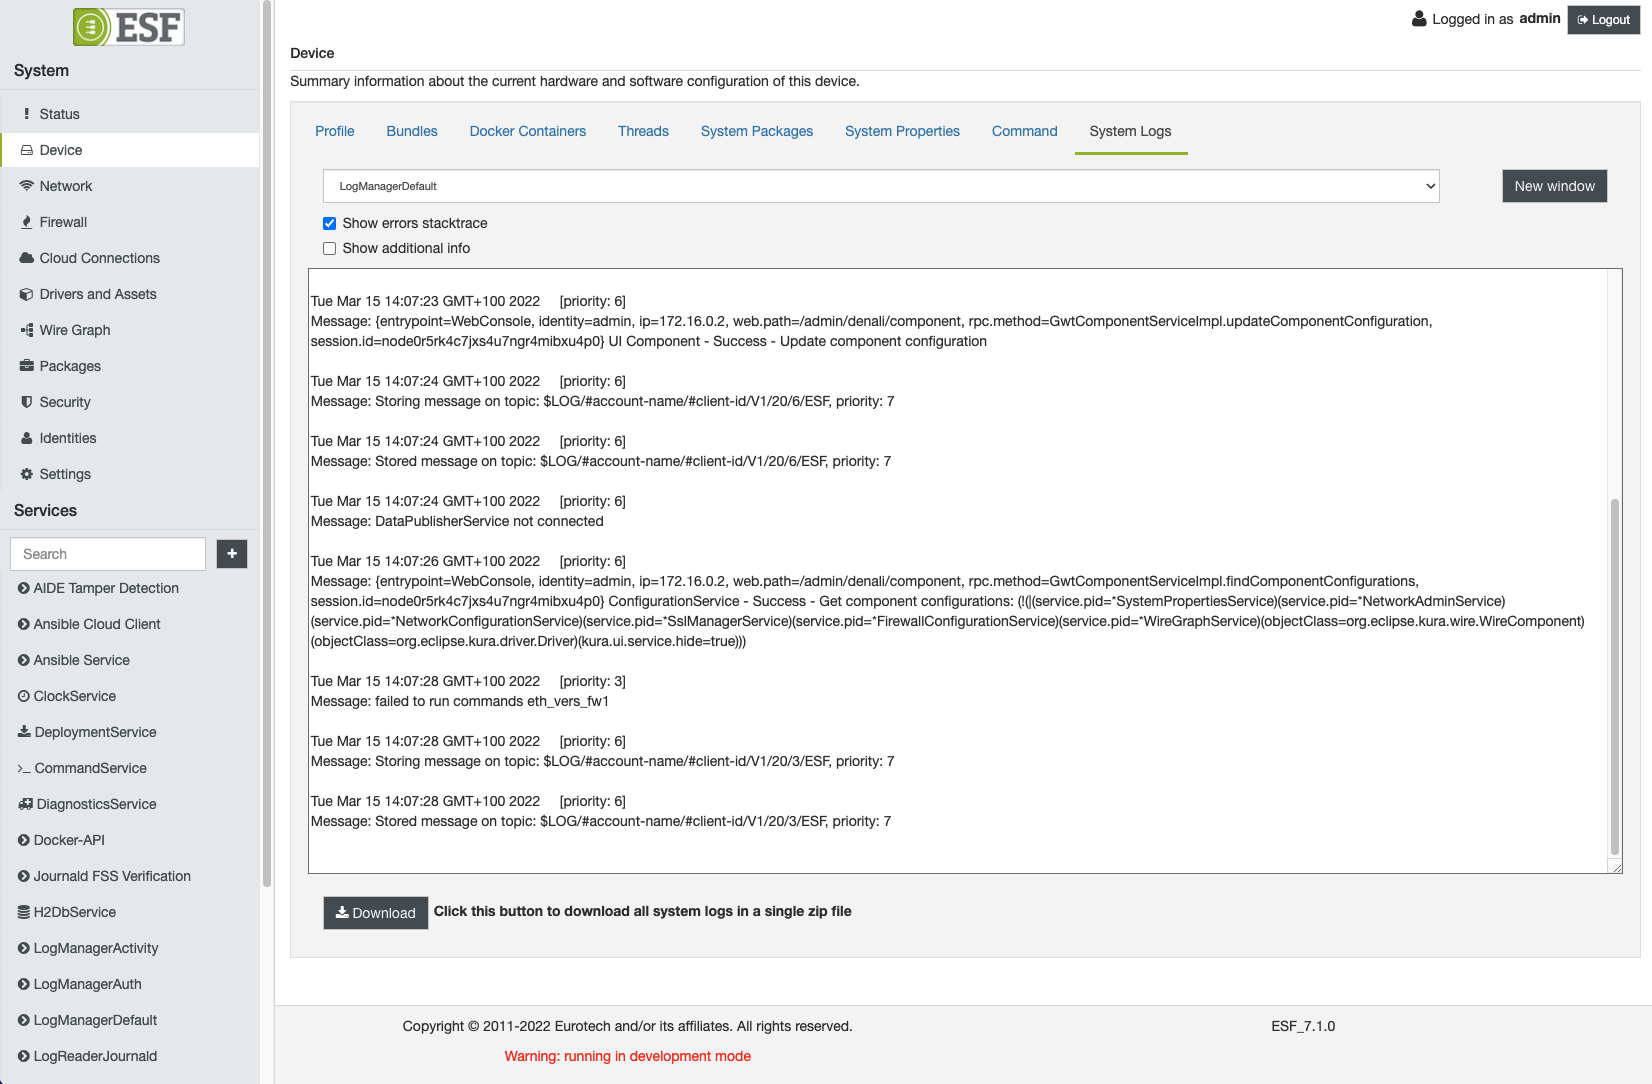
View device logs in the local web UI
Once the log analytics feature has been set up, there will be several active LogManagers. Those components enable the log view feature in the WebUI.
To access the feature, enter the "Devices" section and switch to the "System Logs" tab. From this view, the user can display the logs from different LogManagers. Any change in the configuration of a LogManager will filter the log entries shown in the UI, as for the publisher case.

The New window button allows to open a new ESF instance in a new browser's window, with the same user. This feature can be handy to view the logs in real-time while performing other operations using the ESF UI.
Configure the desired Log Managers or create new ones to filter only the needed log entries. For some Log Manager configuration examples, refer to the Usage Examples.
To limit data transferring between server and client, the log entries are cached on the server-side for a maximum of 1000 units. The server starts reading and storing the logs right after the login. Hence, logs generated before the login are not retrieved.
The entries are polled from the server's cache by the client when the "Devices" section is accessed, and the polling stops when the user exits the section. The frequency of requests is slowed down when no new entries are found on the server's cache, or when a request failed. Because of the cache size limit on the server, some entries may be lost.
Updated 6 months ago
